The goal of the shift was to investigate if it is possible to reduce the coupling of the stray light by moving the homodyne PDs far from the minimum waist where they are estimated to be located. In particular we aim at reducing the bump below about 10Hz seen in the HD_diff_audio spectrum. We have the LO arriving at the homodyne PDs, EQB1 delay line disengaged, SQB1 back reflector disengaged and SQZ beam reflecting back from the locked filter cavity.
It was not possible to perform a scan along z due to the non-repeatability of the steps taken by the PDs motors. However, a single shift along z by about one Raylight range was attempted. No difference in bump behavior was observed at 10Hz (please note however that we don’t know the starting position in relation to the waist, so the change in beam characteristics may have been small).
Other main results obtained during the shift are:
PD motors scans and centering
2022-02-09 15:27 UTC: We start by scanning the x direction of HD PD1: if one could trust the motor step size to be constant, we could hence estimate the waist size and the x-length of the sensor. We did a first scan by hand.
Starting position:
| | X | Y | Z | DC |
| PD1 | -2380 | 1620 | 0 | 0.769 |
| PD2 | -3070 | 1450 | 0 | -0.775 |
Manual scan:
| | 2022-02-09 16:09 UTC | 2022-02-09 16:47 UTC | 2022-02-09 17:00 UTC | 2022-02-09 17:03 UTC |
| scan | PD1_X negative | PD1_X positive | PD2_X positive | PD2_X negative |
| start | -2380 | -6000 | -3070 | -2900 |
| stop | -6000 | -5700 | -2900 | -4100 |
We notice that there is a difference in the response of the actuators while moving along the positive and negative x-direction.
2022-02-09 19:45 UTC
Then we made use of an ad-hoc script that allows for automated scans of the PDs along one direction.
PD2_X positive auto scan: 700 steps total, in step of 10 every 2 seconds
PD2_X negative auto scan: 2300 steps total, in step of 10 every 2 seconds
This way we could estimate that the step size ratio moving in different directions is negative/positive = 2.33. After the scan we recentered the PD wrt the LO beam.
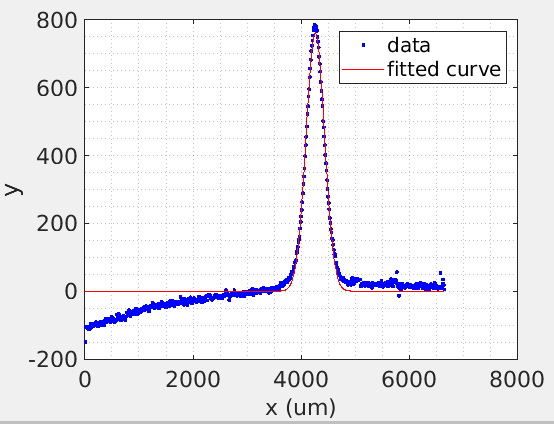
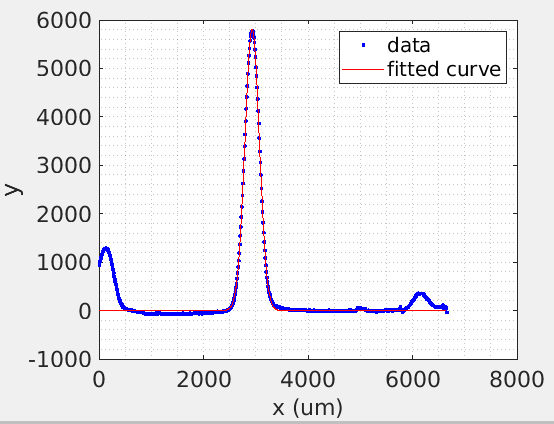
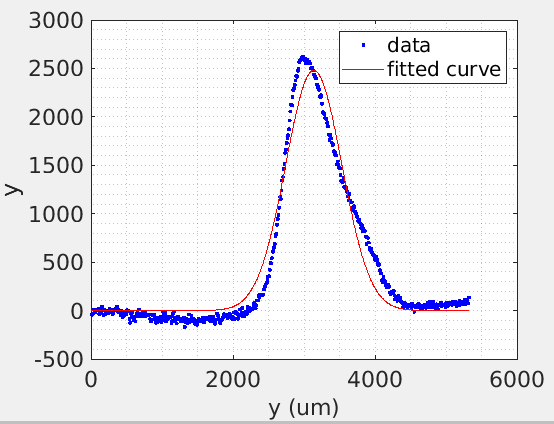
Fig1 shows the different behavior between the two directions. In particular it is also visible the presence of two symmetric side peaks around the central plateau.
2022-02- 09 20:28 UTC
We repeated the same scan along x with PD1.
PD1_X positive auto scan: 4000 steps total, in step of 10 every 2 seconds
PD1_X negative auto scan: 7000 steps total, in step of 10 every 2 seconds
PD1_X positive auto scan: 1000 steps total, in step of 10 every 2 seconds
We obtained that the step size moving along negative/positive = 2.23.
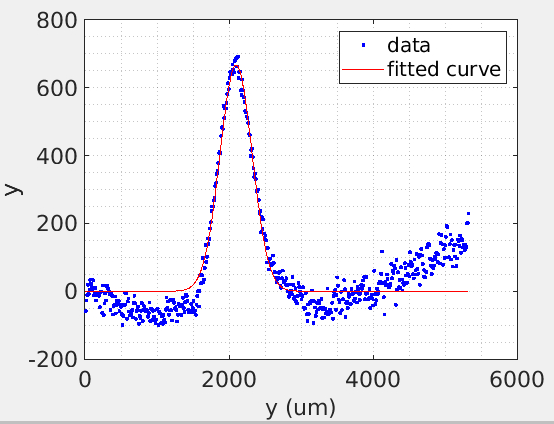
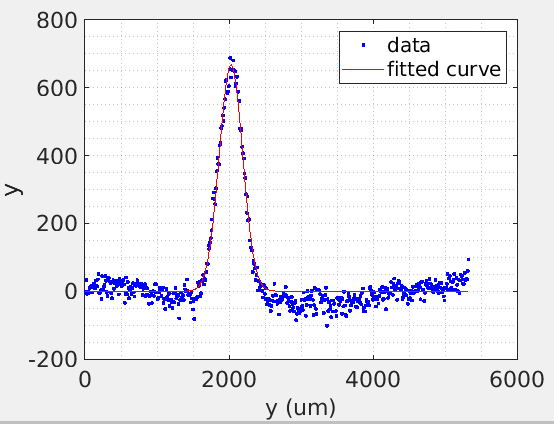
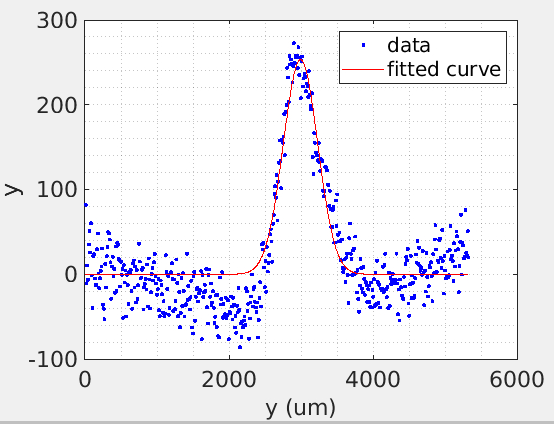
Fig 2 shows the behavior in the positive and negative directions.
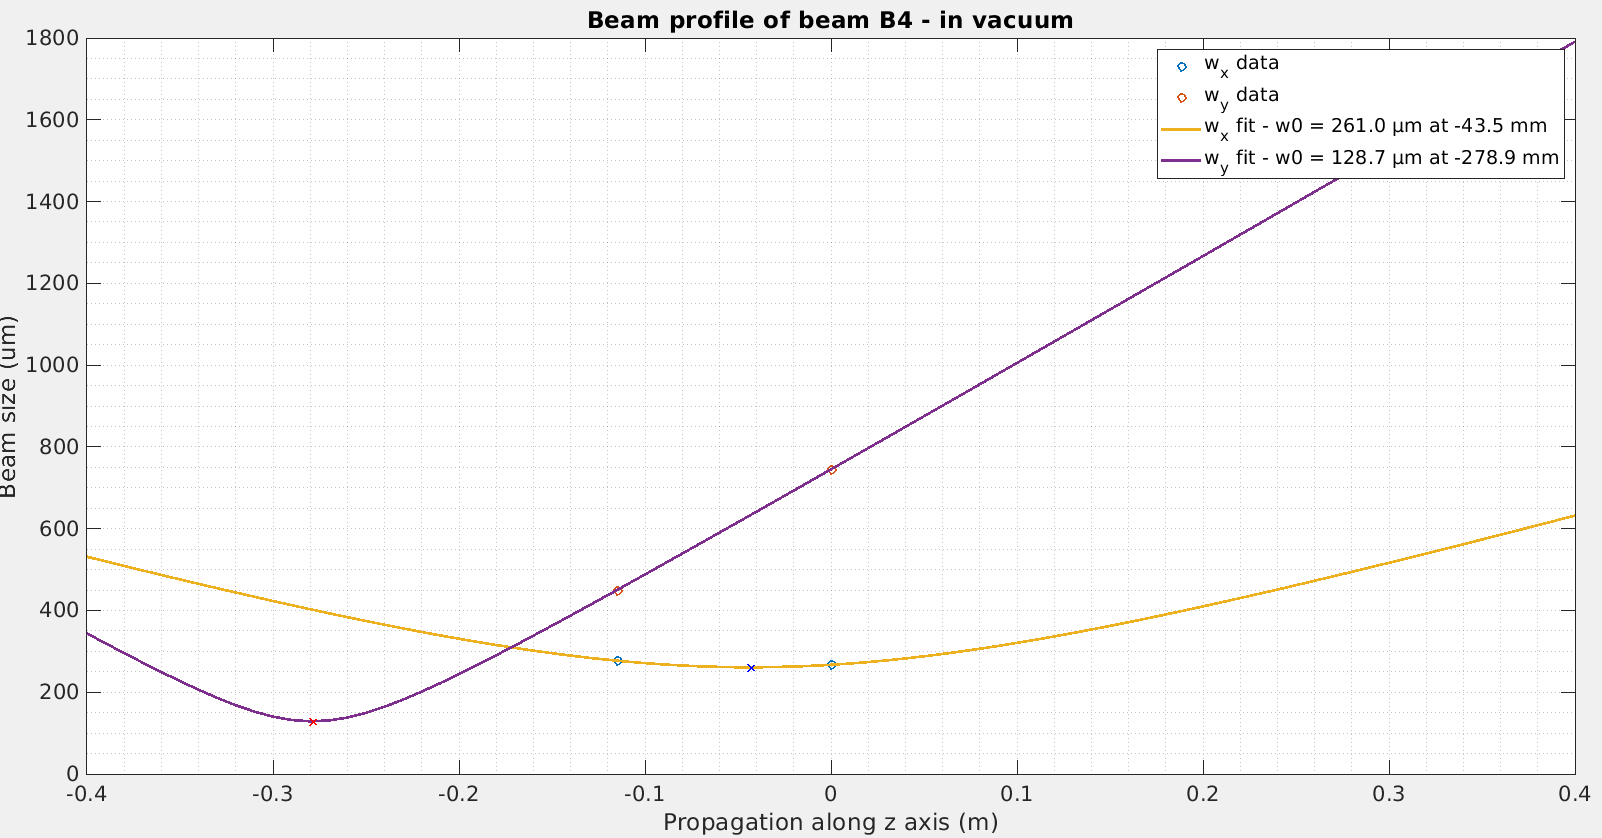
When moving the PD1 towards negative direction we observe an asymmetry in the PD dc output between when the beam enters the PD wrt when it exits: probably due to non uniformity of PD active area and/or to not symmetric beam. From the positive scan we can measure a waist=15um.
2022-02- 09 22:09 UTC
We recentered both the PDs on the beam. We optimized the dc ratio PD1_HD/PD2_HD=0.992. This was the starting value before the shift.
We took a few minutes in quiet condition as a reference for the stray light bump at 10Hz.
Attempt at reducing stray light bump
2022-02- 09 22:09 UTC
We made an attempt to move PD1 along Z, to see if the stray light effect can be reduced. We started with PD1 in position z=0 and we made +700 steps, which should correspond to a Raylight range for the 15um beam waist (assuming about 1um/step). After the steps in Z, the power on PD1 was almost lost. DC output went to about 0.3V from 0.77V and the plateau was about 1400 steps along the negative direction. During this scan we arrived at x=-22300 and we noticed that the motor gradually stopped responding as we moved towards the negative direction. The motor responded only in positive.
2022-02- 09 22:43 UTC
We moved x and y to recenter the PD.
PD1_X positive auto scan: 40 steps (we were stuck on the waist shoulder moving in negative direction)
PD1_Y positive auto scan: 150 steps
One possible explanation for the larrge correlation between z and y displacement is that the beam goes from the lens to the PD with a slope (assuming 1um/step, theta=15 degrees)
2022-02- 09 23:01
With PD1 finally centered and the ratio PD1_HD/PD2_HD=0.991, we took data to check if the bump at 10Hz was changed. We did not observe relevant differences with respect to the reference (fig 3).
2022-02- 09 23:13
We moved the PD1 back by -700steps, nominally reaching the original z=0 position. We expect the two directions to have a factor 2 difference as for X and Y so likely the original position is not reached. We recentered the PD along x and y obtaining again PD1_HD/PD2_HD=0.991.
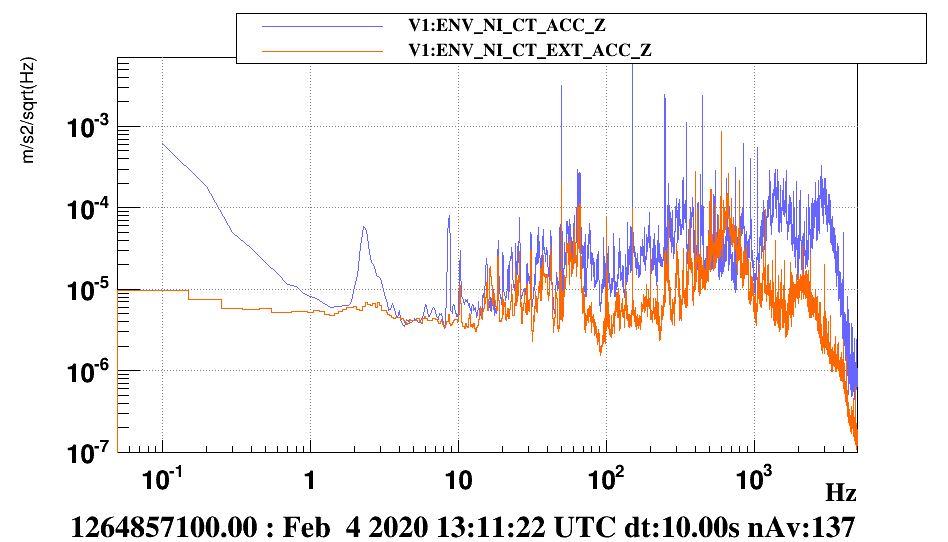
Fig 4 is the spectrum of HD_DIFF_AUDIO at the end of the shift
(particle count density of
)
)
)


